

Advanced Grouping in Excel and Power Query
- V E Meganathan
- Apr 28, 2025
- 2 min read
Group based on blank row:
The source data includes a Quantity column and an Amount column, with groups divided by blank rows. We need to create a table where the Quantity and Amount are summed for each group.

Excel Solution:
=GROUPBY("Group "&SCAN(1,A2:A17>0,LAMBDA(a,v,IF(v,a,a+1))),A2:B17,SUM,0,0)
The SCAN function assists in generating a group number that can be utilized in the GROUPBY function.
Arguments of the SCAN function include:
=SCAN(initial_value,array,function)
initial_value -> 1
array -> {TRUE;TRUE;FALSE;TRUE;TRUE;TRUE;FALSE;TRUE;TRUE;FALSE;TRUE;FALSE;TRUE;TRUE;TRUE;TRUE}
Inside LAMBDA, 2 variables are declared:
a -> Accumulator
v -> Current value
During the initial iteration,
the starting value is set as the accumulator, making 'a' equal to 1,
The current value is the first element in the array, which is TRUE.
Within the LAMBDA calculation,
if the current value is TRUE, it returns the accumulator; otherwise, it returns the accumulator plus 1.
In our scenario, 'v' is TRUE, so we select 1,
During the second iteration,
the outcome from the previous iteration serves as our accumulator, making 'a' equal to 1.
Since 'v' is TRUE, we once again choose the value of 'a', which remains 1.
During the third iteration,
a -> 1,
v -> FALSE,
because v is FALSE, our calculation adds 1 to 'a', resulting in 'a' becoming 2.
Whenever our calculation encounters a blank as the current value, it increases the accumulator by 1.
Result of SCAN function is,
{1;1;2;2;2;2;3;3;3;4;4;5;5;5;5;5}
Combine this array with "Group" to use it as a row_field in the GROUPBY function.
Value_fields are Quantity and Amount column. In the function argument feed SUM to sum Quantity and Amount columns based on unique group.
𝗠-𝗖𝗼𝗱𝗲:
let
Source = Excel.CurrentWorkbook(){[Name="Table1"]}[Content],
Group = Table.SelectRows(Table.Group(Source,"Quantity", {{"Qty", each List.Sum([Quantity])},{"Amount", each List.Sum([Amount])}},0,(x,y) => Number.From(y is null)), (f) => f[Qty] <> null),
Result = Table.RenameColumns(Table.ReplaceValue(Group, each [Quantity], each "Group " & Text.From(Table.PositionOf(Group,_) + 1),Replacer.ReplaceValue,{"Quantity"}), {"Quantity","Group"})
in
Result
Source step helps us to pick table into power query editor.
in Group step,
Table. Group function has 5 arguments as shown below.
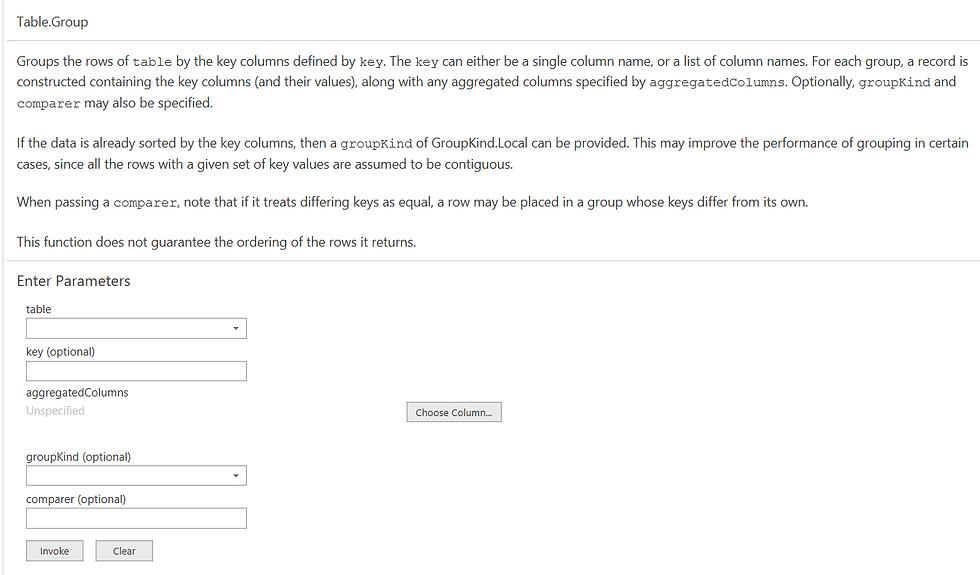
In the table argument, refer to the Source step.
For the key argument, refer to the column we will use for grouping.
In our case, we don't need to worry about the groupKind argument, so we can use either GroupKind.Local or GroupKind.Global.
The Comparer argument will assist us in creating a custom group.
Declare two variables: the first one is Current row, and the second one is Next row.
(x, y) => Number.From(y is null)
'y is null' will give us a boolean value of TRUE or FALSE. If the next row is null, a new group will be created; otherwise, the rows will be added to the same group.
The result of this comparer function must be a number, 0 or 1, so we wrap it inside the Number.From function.
In aggregated columns as list
{{"Qty", each List.Sum([Quantity])},{"Amount", each List.Sum([Amount])}}
The list within a list structure allows us to generate multiple columns after grouping.
The first column is named "Qty," and it sums the Quantity column within the grouped table.
The second column is named "Amount," and it sums the Amount column within the grouped table.
Replace the Qty column with group numbers and rename the "Quantity" column to "group".


Comments